There’s an App for That! Why Risk Calculators Fail to Detect Heart Attacks
Case Presentation
A 52-year-old extremely fit nurse presents to the ER via EMS with accelerating chest pains over several days. She is quite anxious initially and an EKG shows relative sinus tachycardia with ST depressions in the precordial leads.
She is given sublingual nitroglycerin and the chest pain improves — she begins to feel better, her heart rate comes down, and the EKG changes resolve. Her initial high-sensitivity troponin is low at 20, but one hour later it is 27, giving her a "delta" of 7 — above the threshold, suggesting a heart attack in progress.
She is taken urgently to the cath lab where she is found to have a high-grade proximal LAD stenosis of 80%, effectively treated with a drug-eluting (coated) stent.
The Hidden History
The next morning on rounds she expresses gratitude but also frustration and disappointment, given a reassuring workup just four years ago, when she self-referred to a cardiologist out of concern over her family history. Her paternal grandmother had died around the same age from a massive heart attack.
At that visit her LDL cholesterol was 160 mg/dL. The cardiologist prescribed a low-dose statin combined with ezetimibe.
While she wanted to be proactive, she was not enthusiastic about starting statins. A coronary artery calcium (CAC) CT scan was performed, which was reassuringly 0. She had also been following a cardiologist expert on one of the well-known medical media outlets for clinicians, who was not shy about his opinion that statins (or other lipid drugs) were not necessary for younger women despite "high LDL cholesterol." Given this advice, combined with the CAC score of 0, she discontinued lipid-lowering therapy.
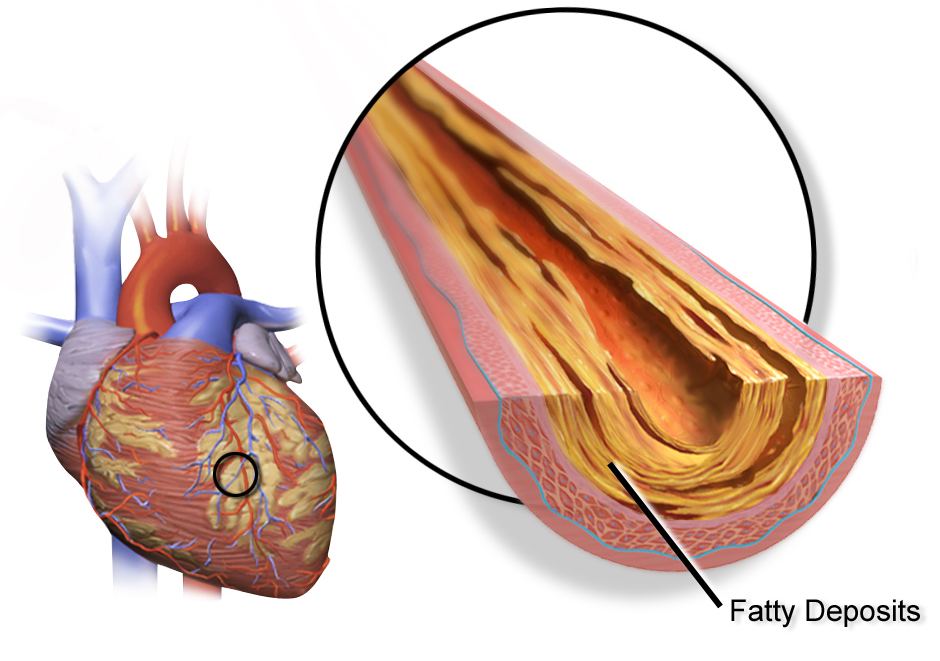
However, a month before admission she began having chest pains at the gym and while hiking. She was seen again in the cardiology clinic and a CT angiogram was performed, revealing a high-grade stenosis in the LAD with predominantly noncalcified plaque, similar to the image below.

She was stable at the time and appropriately referred for an outpatient left heart catheterization with coronary angiography, but the symptoms worsened and she called 911.
The Risk Calculator Failure
| Risk Calculator | Estimated Risk | Clinical Category |
|---|---|---|
| PREVENT-ASCVD (NEW, 2026) | ~0.4% (10-year) | Borderline-Low |
| PREVENT-ASCVD (NEW, 2026) | ~3-5% (30-year) | Borderline-Intermediate |
| PCE (Older standard) | 0.8% (10-year) | "Low risk" |
| Reynolds Risk Score | 0.4% (10-year) | "Low risk" |
| Lifetime Risk (older method) | 39% | HIGH risk |
Flying Under the Radar
Risk assessment is challenging in young people. It's perhaps most challenging for young women without obvious risk factors. Why? Many reasons, but the most glaring is that most cardiac (ASCVD) risk calculators focus on "10-year" risk — what we consider "short-term" risk. Some offer "lifetime" or "30-year" long-term risk assessment, but these are used far less often.
Let's be honest — we all want simple answers to complex questions. Medicine is no different. To accomplish that, we develop all kinds of tools and calculators in an attempt to make the subjective into objective data points, or to distill an individual down to the lowest common denominator, or to take a large population and pull out the mean (average) characteristics and apply that to the patient sitting in front of us.
While these tools offer us a starting point in risk assessment discussions, our human tendency to rely on them for concrete black-and-white answers leads us astray.
The organizations that generate such calculators want us to use them and use them frequently. "There's even an app for that!" As of 2026, the landscape of cardiovascular risk assessment has shifted dramatically. The American College of Cardiology (ACC), American Heart Association (AHA), and National Lipid Association (NLA) have endorsed PREVENT-ASCVD as the primary U.S. risk calculator, replacing the Pooled Cohort Equation (PCE) — ASCVD Risk Estimator +. This represents the most significant shift in risk assessment in over a decade.
The shift to PREVENT matters because it changes the conversation fundamentally. The PCE and PREVENT give very different answers for the same patient. But before diving into why, let's understand what went wrong with the older approach and why PREVENT is a step forward.
This matters because real patients are caught in the gap between what the old calculator says (PCE) and what the new one says (PREVENT). Our case patient, if evaluated today with PREVENT instead of PCE, would see a very different risk profile — one that might have prompted earlier, more aggressive lipid management.
What Changed in 2026: The PCE vs PREVENT Shift
The 2026 ACC/AHA/NLA Dyslipidemia Guideline marks a watershed moment. Here's what's new:
- PREVENT replaces PCE as primary U.S. calculator (Class I, Level B-NR): This is not a suggestion or an alternative — it's the new standard of care. PREVENT was derived from approximately 3.3 million contemporary U.S. adults, compared to the PCE's ~25,000. The evidence base is orders of magnitude larger.
- PREVENT estimates are 40-50% LOWER than PCE for the same patient: This is critical. A patient with a PCE "low risk" (e.g., 3-5%) may have a PREVENT risk of 2-3%. The math gets worse in the opposite direction: PCE ≥5% roughly corresponds to PREVENT ≥3%. The guideline provides Table 12 in the guideline as a crosswalk between the two.
- New risk thresholds: PREVENT defines:
- Low risk: <3% (vs. PCE <5%)
- Borderline risk: 3-<5% (new category)
- Intermediate risk: 5-<10%
- High risk: ≥10%
- Race/ethnicity removed (social construct, not biology): PREVENT uses sex-specific equations instead of race, addressing the longstanding critique that race as a variable in medical algorithms amplifies health inequities. The guideline committee recognized that social factors drive disparities, not genetic ancestry.
- PREVENT provides 30-year AND heart failure risk: Unlike PCE, which gave 10-year ASCVD only, PREVENT calculates lifetime (30-year) risk simultaneously and provides separate heart failure prediction. This addresses the age-related bias that haunted our case patient.
- Optional enrichment data: PREVENT can incorporate HbA1c, albumin-to-creatinine ratio (kidney health), and zip code (social deprivation index) if available — allowing for deeper personalization without requiring them.
- FH-specific guidance (COR 3: Harm): The 2026 guideline explicitly states that standard risk calculators should NOT be used for familial hypercholesterolemia (FH) patients. Using them is listed as COR 3 (benefit does not outweigh harm) — meaning it can lead to dangerous undertreatment. FH patients belong in FH-specific scoring systems like the Montreal FH-SCORE or the AHA FH-Risk Score.
- A new framework: Calculate-Personalize-Reclassify (CPR): Rather than treating risk calculators as the final word, the guideline now recommends a three-step approach:
- Calculate: Start with PREVENT (10-year and 30-year)
- Personalize: Layer in risk enhancers (Lp(a), hsCRP, family history, kidney function, etc.)
- Reclassify: If uncertainty remains, use CAC scoring to confirm or escalate treatment intensity
This is why PREVENT's built-in 30-year calculation matters so much. Our patient's PCE 10-year risk was 0.8% — dangerously reassuring. But if the same data were run through PREVENT today, clinicians would immediately see both her 10-year AND 30-year risk in one place. The 30-year view reveals what the 10-year masked: ongoing, cumulative exposure to atherogenic lipoproteins that would compound over decades.
The 2026 guideline emphasizes that lifetime cumulative exposure to atherogenic lipoproteins is the driver of atherosclerosis, not birthdays. PREVENT's dual-risk reporting helps anchor this concept in clinical practice.
CardioAdvocate™ Checklist
Baseline Risk Assessment Tools
Family History
Risk Enhancers (2018 ACC/AHA)
Chronic Conditions & Additional Risk Factors
Questions to Ask Your Clinician
Deep Dive
This is a living section — content will be updated as new evidence emerges.
Does PREVENT Actually Prevent Events? The Evidence Base
The shift to PREVENT represents a substantial improvement in the evidence base, but it's important to be honest about what we know — and don't know — about whether any risk calculator actually prevents events.
PREVENT was derived from the PREVENT Equations study, which pooled data from approximately 3.3 million contemporary U.S. adults from electronic health records and observational cohorts. The sample size alone is orders of magnitude larger than the PCE's ~25,000. However, like the PCE before it, PREVENT has not yet been validated in a randomized controlled trial (RCT) showing that using it to guide therapy actually reduces cardiovascular events. That RCT may never happen — it would be enormous and expensive.
What we do have are validation studies. Notably, one validation analysis published in 2023 examined PREVENT's performance in contemporary cohorts and found a critical limitation: 51% of patients classified as "low risk" by PREVENT had evidence of coronary artery calcium (CAC) >0. This mirrors the problem with PCE — a "low-risk" label from a calculator is not the same as "no disease."
This validation gap is exactly why the 2026 guideline introduced the Calculate-Personalize-Reclassify (CPR) framework. PREVENT is the starting point (Calculate), but it must be combined with risk enhancers (Personalize), and if uncertainty remains, imaging like CAC is recommended to confirm risk stratification (Reclassify).
A 2017 Cochrane systematic review of 41 RCTs involving 194,035 participants found that providing CVD risk scores may have little or no effect on CVD events (5.4% vs 5.3%; RR 1.01, 95% CI 0.95–1.08), though the quality of evidence was low. This sobering finding applies to PCE but may not fully apply to PREVENT given its newer, larger evidence base. Still, the takeaway is clear: a risk calculator is a starting point for discussion and shared decision-making, not a final answer or prescription trigger.
How Do We Improve on Risk Calculators? The CPR Framework
The 2026 guideline answers this directly with a three-step framework: Calculate-Personalize-Reclassify (CPR). Rather than accepting a calculator's verdict as final, CPR treats risk assessment as an iterative process:
CALCULATE: Start with PREVENT for both 10-year and 30-year risk. The dual timescales address the age-related bias that plagued PCE, especially in young adults and women.
PERSONALIZE: Layer in risk enhancers that the calculator may miss or underweight:
- Lipoprotein(a) [Lp(a)] — 90% genetic, affects ~20% of the population
- High-sensitivity C-reactive protein (hsCRP) — reflects inflammation
- Family history of premature ASCVD — doubles estimated risk per CCS guidelines
- Kidney function (albumin-to-creatinine ratio, eGFR)
- Reproductive factors in women (premature menopause, preeclampsia, gestational diabetes)
- Social determinants — zip code, income, education (PREVENT now captures social deprivation index as an optional input)
RECLASSIFY: If uncertainty remains after Calculate and Personalize steps, use CAC scoring to confirm or escalate treatment intensity. CAC remains the gold standard reclassifier, able to move nearly 10 times more patients into the correct risk category than biomarkers like CRP.
This three-step approach avoids the trap of treating a calculator as a black box. Instead, clinicians and patients engage in shared decision-making at each step.
Our case patient illustrates the fundamental challenge: sometimes a risk calculator gets it wrong. A PCE of 0.8% with a lifetime risk of 39% created cognitive dissonance that led to discontinuation of lipid therapy — a decision that proved catastrophic. PREVENT's dual-risk reporting (10-year AND 30-year simultaneously) would have made that gap visible.
But even with PREVENT, sometimes what's obvious in hindsight is not obvious in real time. Consider this quote:
— Huang Dee: Nai Ching (2600 BC, First Chinese Medical Text)
Net Reclassification Improvement (NRI)
The low and intermediate risk patients make up a large population of individuals where "primary" prevention interventions can be invoked. But some of those interventions, particularly drugs, can have drawbacks such as side effects, expense, or variable efficacy across individuals. We're talking about safety, efficacy, and cost.
Patients in low and intermediate risk groups are very heterogeneous (have different characteristics). Some — perhaps many — may be incorrectly classified. Maybe they're high risk and we don't know it (like our patient). Maybe some of them are much lower risk (the 75-year-old female with hypertension and calcium score of 0 who may benefit less from taking that aspirin). So, we need to be more precise. We need to "reclassify" a lot of people — shift some into the high-risk category and shift others down into the low or very-low-risk category.
We call this Net Reclassification Improvement (NRI).
Receiver Operating Characteristic (ROC) Curve and C-Statistic

The ROC curve is the graphical representation and the C-statistic is the area under the curve (AUC). If we were all-knowing, we would be at the upper-left corner and have a C-statistic of 1.0. If we were tossing a coin, we'd be on the diagonal line with a C-statistic of 0.5.
According to the JAMA Users' Guide on Discrimination and Calibration of Clinical Prediction Models: a C-statistic <0.60 reflects poor discrimination, 0.60–0.75 indicates possibly helpful discrimination, and >0.75 suggests clearly useful discrimination.
The Framingham Risk Score (the classic 10-year risk calculator), for instance, has a C-statistic of approximately 0.75–0.80 depending on the population (ACCF/AHA 2007 Clinical Expert Consensus Document on Coronary Artery Calcium Scoring).
When we utilize additional testing, we can either shift the curve upward and to the left if the test helps our predictions, or it may shift it toward the diagonal if it worsens our ability to classify.
What Improves Risk Prediction? NRI Comparison
| Biomarker Added to Model | NRI | C-Statistic Change | Strength |
|---|---|---|---|
| CAC (Coronary Artery Calcium) | 19–66% | +0.04 to +0.16 | Strongest |
| Family History | ~19% | Variable | Strong |
| Lp(a) + Family History | ~21% | +0.004 | Moderate NRI |
| ApoB | 8–11% | Minimal | Modest (best when discordance present) |
| hsCRP | 2–12% | +0.004 to +0.015 | Weakest reclassifier |
CAC vs CRP: Head-to-Head
Coronary artery calcium (CAC) scoring, when added to the Framingham Risk Score, improves the C-statistic by approximately 0.04 to 0.16, with net reclassification improvement (NRI) ranging from 19% to 66%. By contrast, when high-sensitivity C-reactive protein (hsCRP) is added to the Framingham Risk Score it provides minimal improvement in the C-statistic (0.004 to 0.015) and NRI of only 2% to 12% (Evaluation of the Incremental Value of a Coronary Artery Calcium Score Beyond Traditional Cardiovascular Risk Assessment: A Systematic Review and Meta-analysis — JAMA Internal Medicine).
The Multi-Ethnic Study of Atherosclerosis (MESA) directly evaluated both markers in 1,330 intermediate-risk individuals (Comparison of Novel Risk Markers for Improvement in Cardiovascular Risk Assessment — JAMA):
CAC improved C-statistic from 0.623 → 0.784 (change: +0.161), NRI 65.9%, HR 2.60 (95% CI 1.94–3.50).
hsCRP improved C-statistic from 0.623 → 0.640 (change: +0.017), NRI 7.9%, HR 1.28 (95% CI 1.00–1.64, borderline).
CAC reclassified nearly 10 times more patients correctly than CRP.
CRP showed only borderline statistical significance for coronary heart disease prediction (High-sensitivity C-reactive protein and cardiovascular disease: a resolute belief or an elusive link?).
ApoB: When LDL-C Misleads
As mentioned throughout this site, ApoB improves upon LDL-C as a biomarker for atherosclerosis due to the fact that all atherogenic particles contain exactly one ApoB molecule. LDL cholesterol concentration is a surrogate for LDL particles, which means it can be discordant at times, particularly when individuals have high triglycerides and low HDL cholesterol. We see this most often with disorders related to insulin resistance and obesity, such as metabolic syndrome, diabetes, prediabetes, and fatty liver disease.
In those patients, LDL-C underestimates LDL particles and therefore underestimates risk. Discordance can also go in the other direction — where LDL-C is represented in relatively fewer, larger LDL particles. In that case, ApoB will be relatively lower. When ApoB and LDL-C are discordant, risk tracks better with ApoB.
When added to risk prediction models using standard lipid biomarkers, the C-statistic changes minimally but the NRI is influenced modestly at 8–11%. Obviously this varies depending on the population. When added to a general population, ApoB isn't much better than LDL-C — that makes sense when they're concordant. But when added to a population with discordance, ApoB improves prediction. The worse the discordance, the better ApoB improves upon LDL-C (Lipid-Related Markers and Cardiovascular Disease Prediction — JAMA).
Family History: The Free Risk Enhancer
Family history of premature ASCVD is typically defined as events in first-degree relatives (parent, sibling, and even offspring) at young ages (males <55 years, females <65 years). This has been shown to increase risk 1.5–2.0×, hence the rationale for the Canadian Cardiovascular Society recommendation to double risk estimates when premature family history of ASCVD is present (2010 ACCF/AHA Guideline for Assessment of Cardiovascular Risk in Asymptomatic Adults).
The Dallas Heart Study and the Multi-Ethnic Study of Atherosclerosis (MESA) showed an NRI of ~19% when family history is added to risk prediction models.
Lipoprotein(a): The Genetic Wild Card
Given that Lp(a) is approximately 90% genetically determined by the LPA gene and elevated levels (at or above 125 nmol/L or 50 mg/dL) are present, by definition, in 1 in 5 families, it's not surprising that family history performs even better when Lp(a) is also elevated — increasing the C-statistic by 0.004 and achieving an NRI of ~21% (Lipoprotein(a) and Family History Predict Cardiovascular Disease Risk). This is a factor that standard risk calculators completely ignore.
30-Year and Lifetime Risk Models
Thirty-year risk models have been found to be better than 10-year models, with C-statistics of 0.738–0.755 for the 30-year models compared to 0.726 for the 10-year model. The expanded cardiovascular disease outcome model had the highest C-statistic of 0.755 (95% CI 0.720–0.789) — a statistically significant improvement of 0.028 (95% CI 0.001–0.053) compared to the 10-year model (Incidence of Atherosclerotic Cardiovascular Disease in Young Adults at Low Short-Term But High Long-Term Risk).
The NRI also reclassified 16% of young adults.
The 2013 ACC/AHA Risk Assessment Guideline writers intended the 30-year risk calculator to be used as a supplement to the 10-year risk in younger adults, because younger adults tend to have lower predicted risk despite having risk factors. Basically, age does impact risk tremendously because it reflects one's cumulative exposure to risk factors. So, an individual may be looking at a high lifetime trajectory but the risk calculators will underestimate that outlook in a young person, giving them a false sense of security.
Thirty-year risk calculators help account for this underestimation to a degree, but still aren't perfect. The lifetime risk calculation, as recommended by the 2018 cholesterol guideline, requires an age of 45 and older. If you're in the 20–39 age group, you must extrapolate (Managing Atherosclerotic Cardiovascular Risk in Young Adults: JACC State-of-the-Art Review).
Notably, the same analysis showed that 40% of young adults with low 10-year risk were classified as high lifetime risk, compared with only 1.6% with 30-year risk. The difference is due to using a continuous risk scale versus using five categories, respectively.
The 2026 Shift: PCE to PREVENT
The 2026 ACC/AHA/NLA Dyslipidemia Guideline formally endorses PREVENT-ASCVD as the preferred U.S. risk calculator (Class I, Level of Evidence B-NR: Nonrandomized). Here's what the evidence shows:
Sample size and contemporary data: PREVENT was derived from ~3.3 million U.S. adults from electronic health records, compared to PCE's ~25,000 from older cohorts (1980s–2000s). The contemporary dataset captures modern risk profiles, including rising rates of obesity, metabolic syndrome, and chronic kidney disease.
Risk estimates are systematically lower: For the same patient, PREVENT typically estimates 40-50% lower risk than PCE. The guideline provides Table 12 as a crosswalk: PCE ≥5% roughly equals PREVENT ≥3%. This shift has major clinical implications. A woman with PCE 5-year risk of 4% might have PREVENT 5-year risk of 2%, potentially changing treatment decisions if thresholds are applied rigidly.
New risk categories: Instead of PCE's simple <5% / 5-7.5% / >7.5%, PREVENT defines four tiers:
- <3% = Low risk
- 3-<5% = Borderline risk (new)
- 5-<10% = Intermediate risk
- ≥10% = High risk
Sex-specific equations without race: PREVENT uses sex-specific models (male and female) rather than incorporating race as a variable. This addresses the decades-long criticism that including race in medical algorithms perpetuates health inequities by treating social factors (access to care, environmental exposure, discrimination) as if they were biological. The guideline acknowledges that disparities in cardiovascular outcomes are driven by social determinants, not genetic ancestry. PREVENT optionally incorporates zip code as a social deprivation index, allowing clinicians to account for neighborhood-level factors without resorting to racial categorization.
Simultaneous 10-year and 30-year risk: Unlike PCE, which required separate calculation for lifetime risk on a different platform, PREVENT calculates both in one place. This directly addresses the problem our case patient faced: a reassuring 10-year risk masked by a concerning lifetime outlook.
Heart failure prediction: PREVENT also provides a separate 10-year heart failure risk estimate — important because HF is a major CVD outcome that PCE doesn't predict.
Optional enrichment: HbA1c, albumin-to-creatinine ratio, and social deprivation index can be entered if known, allowing deeper personalization without requiring them for the base calculation.
Online calculator: PREVENT-ASCVD is available free online from the American Heart Association. Clinicians should begin transitioning to PREVENT for all patients without established CVD starting now.
JACC Focus: A Life-Course Approach to Cholesterol in Women (February 2026)
The February 2026 JACC Focus Issue on Women's Cardiovascular Health includes a Viewpoint by Dr. Michael Honigberg that directly validates the concerns raised by our case patient — and this article. His central argument: we must move beyond short-term, age-driven risk calculators toward a life-course approach that accounts for cumulative exposure to atherogenic lipoproteins.
- 10-year risk calculators underestimate lifetime burden in young women — exactly the failure our 52-year-old patient experienced at age 48
- Statin decisions should account for reproductive goals and pregnancy planning
- Shared decision-making needs individualization, not rigid calculator thresholds
This reversal occurred during the very period when risk calculators and guidelines should have been improving outcomes. Instead, the data suggests we are missing the mark on primary prevention in the populations most failed by 10-year risk calculators: young adults and women.
A "Uniquely American" Crisis (Harvard / JACC Stats 2026)
A Harvard Gazette analysis of the inaugural JACC Cardiovascular Statistics 2026 report (Wadhera et al.) underscores the systemic nature of this failure:
- One in two U.S. adults has high blood pressure — with little change since 2009
- Only two in three adults with hypertension receive treatment
- Hypertension-related CV deaths nearly doubled from 2000–2019 (23 to 43 per 100,000)
"Many other higher-income countries are grappling with rising obesity and diabetes, but the U.S. stands out for how consistently those risks translate into worse cardiovascular outcomes, and how wide the gaps are by income, race, ethnicity, and geography." — Dr. Rishi Wadhera, Harvard.
Enhanced HEART Score: Improving Acute Chest Pain Assessment
A new study published in the Journal of Clinical Medicine from Centro Cardiologico Monzino demonstrates that adding clinical and laboratory variables to the traditional HEART score significantly improves prediction of significant coronary artery disease on CT angiography (CCTA).
The standard HEART score performance in this cohort revealed an important gap:
| HEART Score Category | % of Cohort | Positive CCTA |
|---|---|---|
| Low risk | 27% | 7% had significant CAD |
| Moderate risk | 67% | 27% had significant CAD |
| High risk | 6% | 67% had significant CAD |
The enhanced model, which incorporated additional clinical and laboratory variables, significantly improved AUC and net reclassification — particularly in the low-to-moderate risk groups where clinical uncertainty is greatest.
Limitations: This was a single-center retrospective study. A positive CCTA does not necessarily equal ACS diagnosis or revascularization need. Coronary calcium and plaque phenotype were not included in the enhanced model.
The broader lesson aligns with the theme of this article: risk stratification tools should guide — not replace — clinical judgment. Patient-centered decision-making integrates pretest probability, local resources, and individual preferences.
Related CardioAdvocate Content
The strongest single reclassifier of cardiovascular risk. Our case patient had a CAC of 0 but developed significant noncalcified plaque.
When LDL-C alone doesn't tell the whole story — why ApoB matters for risk prediction.
The genetic risk factor that standard risk calculators completely ignore.
When LDL-C of 160+ signals a genetic condition — our case patient's LDL-C of 160 mg/dL should have raised this concern.
Where CRP fits in risk assessment — and its limitations as a reclassifier compared to CAC.
When high triglycerides, low HDL-C, and small dense LDL particles create discordance between LDL-C and ApoB.
Insulin resistance and metabolic syndrome are risk enhancers that calculators underweight.
Sex-specific risk factors and why risk calculators systematically fail young women.
Preeclampsia, gestational HTN, and gestational diabetes as risk enhancers for future ASCVD.
When risk assessment suggests referral to a preventive cardiologist or lipid specialist.
Understanding the strengths and limitations of cardiovascular risk prediction tools.
The Bottom Line
- PREVENT has replaced PCE as the primary U.S. risk calculator as of 2026. Ask your doctor which calculator they're using — and if they say "the older PCE," know that an upgrade is available.
- PREVENT estimates are 40-50% lower than PCE for the same patient. This doesn't mean PREVENT is "better" (it has a larger, more contemporary database), but it does mean risk thresholds have shifted. PCE ≥5% roughly equals PREVENT ≥3%.
- Birthdays don't cause atherosclerosis. Lifetime cumulative exposure to atherogenic lipoproteins does. PREVENT's built-in 30-year risk calculation helps reveal this in young adults where 10-year risk alone is misleadingly low.
- The Calculate-Personalize-Reclassify (CPR) framework is now the standard approach: Calculate with PREVENT, Personalize with risk enhancers (Lp(a), hsCRP, family history, kidney function, reproductive factors), Reclassify with CAC if needed.
- Don't use standard calculators for FH patients. The 2026 guideline explicitly states this is COR 3 (Harm) — use FH-specific scores (Montreal-FH-SCORE, AHA FH-Risk Score).
- Risk calculators are starting points, not final answers. Validation data show 51% of PREVENT "low-risk" patients have CAC >0.
- Family history, Lp(a), ApoB, and CAC are not captured adequately by calculators alone. These are the "Personalize" step of CPR.
- CAC is the strongest single reclassifier of cardiovascular risk — reclassifying nearly 10× more patients correctly than CRP.
- ~75% of first MI patients would not have qualified for statins the day before their event based on risk calculator alone.
- A 30-year or lifetime risk of 39% is not "low risk" — regardless of what the 10-year calculator says. Our case patient learned this the hard way.
- February 2026 data confirms the gap is widening: Young adult MI deaths are rising (women hit hardest), JACC Stats 2026 shows implementation has stalled, and a JACC Focus Issue calls for a life-course approach to risk assessment — especially for women. PREVENT is a step forward, but shared decision-making and risk enhancers remain essential.